python可视化编程--matplotlib(二散点图)
本文共 2043 字,大约阅读时间需要 6 分钟。
1、画单个点
# 散点图plit.scatter(2, 4,marker='o',c='b')plit.title("scatter", fontsize=14)plit.xlabel("x", fontsize=14)plit.ylabel("y", fontsize=14)plit.ticklabel_format(axis='both')plit.show() 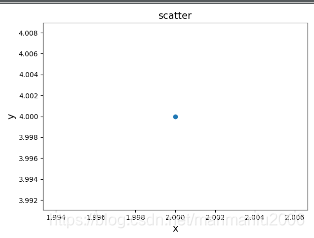
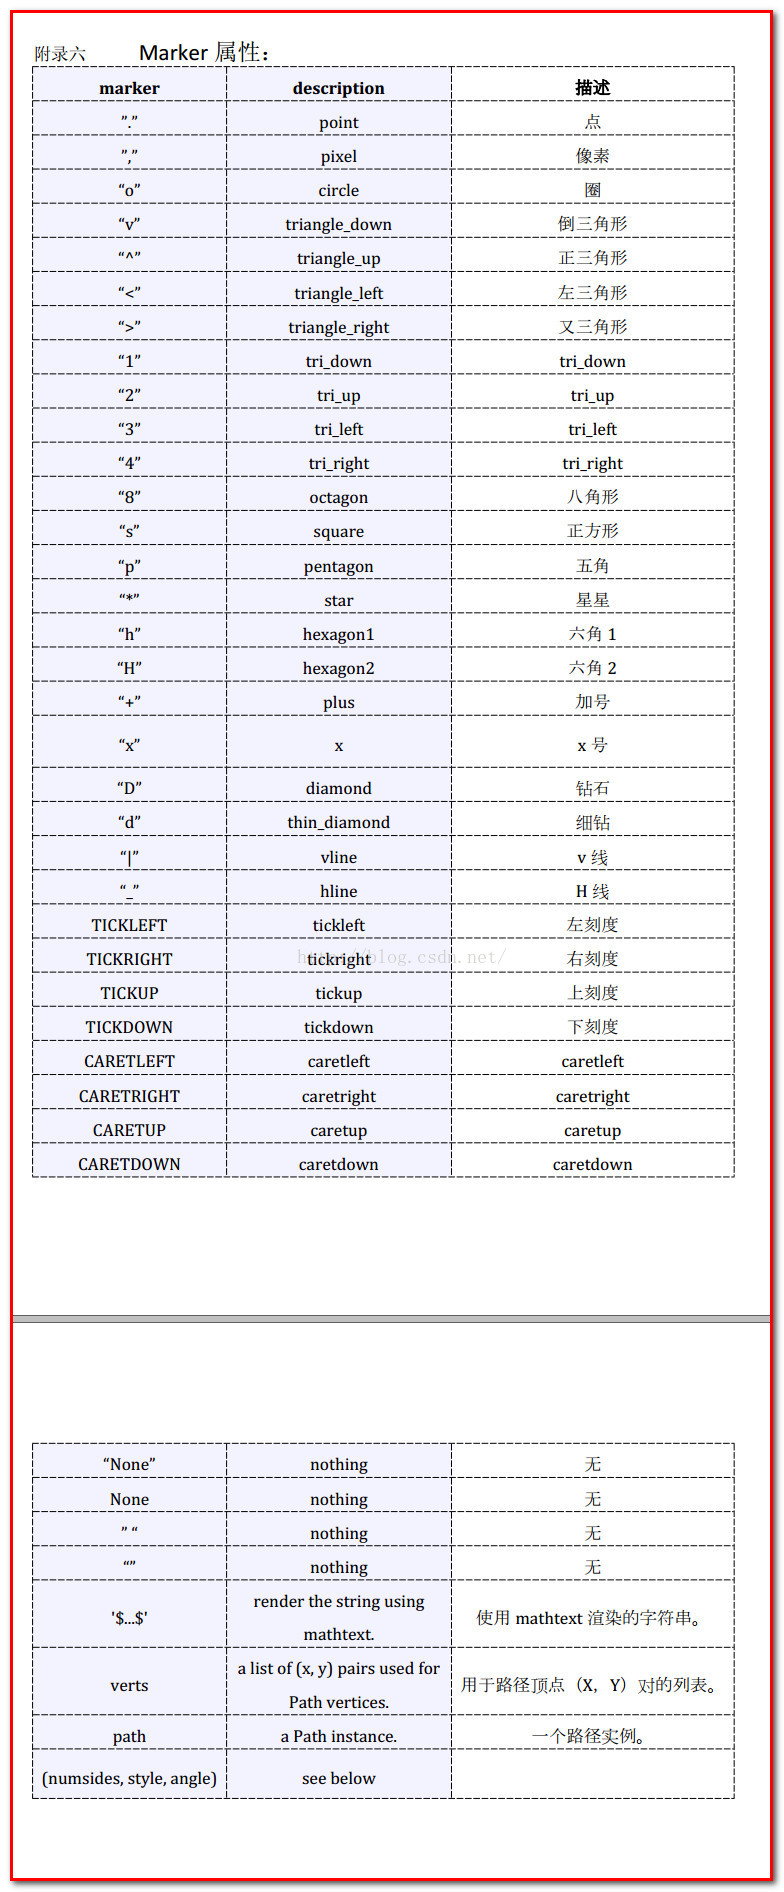
marker的类型:
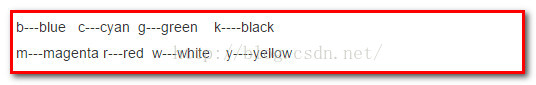
颜色参数C的值:
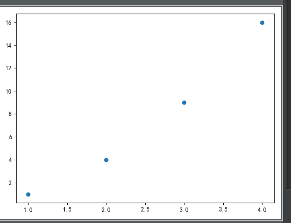
2、自动计算
xV = list(np.arange(1, 5))y = [x ** 2 for x in xV]plit.scatter(xV, y,c=(0, 0.5, 0.3))plit.show()
3、颜色映射
plt.scatter(x,y,c=y,cmap=plt.cm.gist_rainbow,s=20)#cm即colormap,c=y表示颜色随y变化
4、自动保存图表
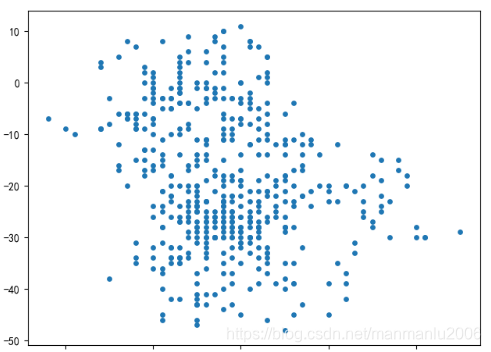
xV = list(np.arange(1, 500))y = [x ** 2 for x in xV]plit.scatter(xV, y, c=y, cmap=plit.cm.hot, s=10)# plit.show()plit.savefig('aaa.png') #图表保存,代替show 5、随机漫步
模拟随机
randomMy.py文件:
# 随机漫步from random import choiceclass RandomWalk(): def __init__(self, num_points=50): self.num_points = num_points self.x_values = [0] self.y_values = [0] def fill_walk(self): while len(self.x_values) < self.num_points: x_direction = choice([1, -1]) x_distance = choice([0, 1, 2, 3, 4]) x_step = x_direction * x_distance y_direction = choice([1, -1]) y_distance = choice([0, 1, 2, 3, 4]) y_step = y_direction * y_distance if x_step == 0 and y_step == 0: continue next_x = self.x_values[-1] + x_step next_y = self.y_values[-1] + y_step self.x_values.append(next_x) self.y_values.append(next_y)
调用文件hello.py
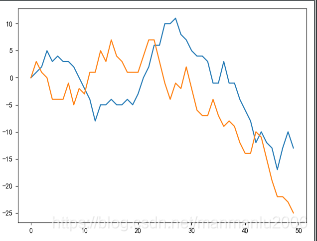
# 随机漫步from randomMy import RandomWalkimport matplotlib.pyplot as plitrwn = RandomWalk()rwn.fill_walk()# plit.scatter(rwn.x_values, rwn.y_values, s=15) #点图1plit.plot(rwn.x_values) #线图2plit.plot(rwn.y_values) #线图2plit.show()
while True: rwn = RandomWalk() rwn.fill_walk() point_number = list(range(rwn.num_points)) plit.scatter(rwn.x_values, rwn.y_values,c=point_number, cmap=plit.cm.hot, s=15)
plit.scatter(0,0,c='green',edgecolors='none',s=100) //图二 重新绘制原点、终点 plit.scatter(rwn.x_values[-1],rwn.y_values[-1],c='red',edgecolors='none',s=100) //图二 重新绘制原点、终点 plit.show() keep_running = input("make anoter walk?(y/n):") 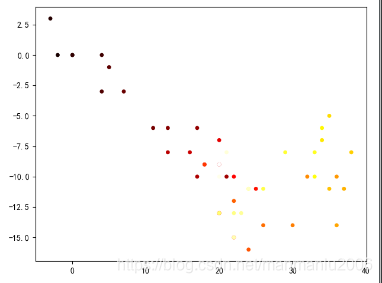 图一
图一 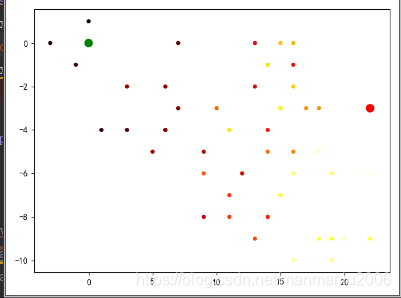 图二
图二
调整尺寸以适应屏幕
plit.figure(figsize=(10,6))
你可能感兴趣的文章
Manjaro 24.1 “Xahea” 发布!具有 KDE Plasma 6.1.5、GNOME 46 和最新的内核增强功能
查看>>
mapping文件目录生成修改
查看>>
MapReduce程序依赖的jar包
查看>>
mariadb multi-source replication(mariadb多主复制)
查看>>
MaterialForm对tab页进行隐藏
查看>>
memcached高速缓存学习笔记001---memcached介绍和安装以及基本使用
查看>>
memset初始化高维数组为-1/0
查看>>
MS UC 2013-0-Prepare Tool
查看>>
MSCRM调用外部JS文件
查看>>
MSSQL数据库查询优化(一)
查看>>
MSSQL日期格式转换函数(使用CONVERT)
查看>>
MSTP是什么?有哪些专有名词?
查看>>
Mstsc 远程桌面链接 And 网络映射
查看>>
Myeclipse常用快捷键
查看>>
MyEclipse用(JDBC)连接SQL出现的问题~
查看>>
myeclipse的新建severlet不见解决方法
查看>>
MyEclipse设置当前行背景颜色、选中单词前景色、背景色
查看>>
MyEclipse配置SVN
查看>>
MTCNN 人脸检测
查看>>
MyEcplise中SpringBoot怎样定制启动banner?
查看>>